Twitch Analytics Explained: 10 Metrics Streamers Should Actually Track
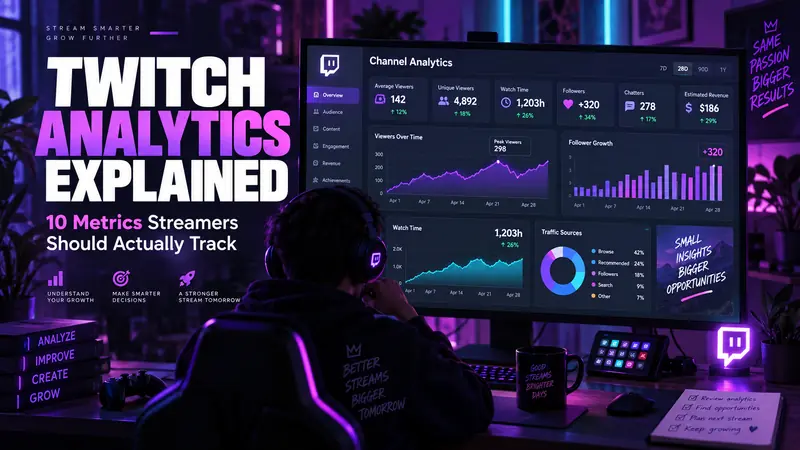
You finish a stream, open Twitch Analytics, and suddenly you’re staring at average viewers, live views, unique viewers, followers, chatters, watch time, subscriptions, revenue, and enough graphs to make you consider going back to blissful ignorance.
The problem isn’t a lack of data.
It’s knowing which numbers actually matter.
A stream can have a huge peak and still perform badly overall. You can reach a ton of unique viewers but struggle to keep any of them around. Your follower count can climb while your average viewership refuses to move.
So instead of asking, “Did my numbers go up?”, ask a better question:
“What do these numbers tell me to change before my next stream?”
That’s what we’re going to figure out.
Which Twitch Analytics Matter Most?
For most growing Twitch streamers, these are the 10 Twitch metrics worth paying attention to:

- Average viewers
- Peak viewers
- Unique viewers
- Live views
- Watch time
- Unique chatters
- New followers
- Discovery and traffic sources
- Follower conversion
- Subscriptions and revenue
The important part is that you shouldn’t read any of these numbers in isolation.
For example:
- Lots of unique viewers but a weak average viewer count can point to a retention problem.
- Strong average viewership but very few unique viewers can point to a discoverability problem.
- Plenty of viewers but barely any new followers can point to a conversion problem.
- Growing viewership with a completely dead chat can point to an engagement problem.
Twitch itself positions analytics as a way to understand what’s working, improve your content, grow your audience, and make smarter streaming decisions.
That’s a much better use of your dashboard than refreshing the viewer counter every 30 seconds.
Where to Find Twitch Analytics
You can find Twitch Analytics through your Creator Dashboard → Analytics.
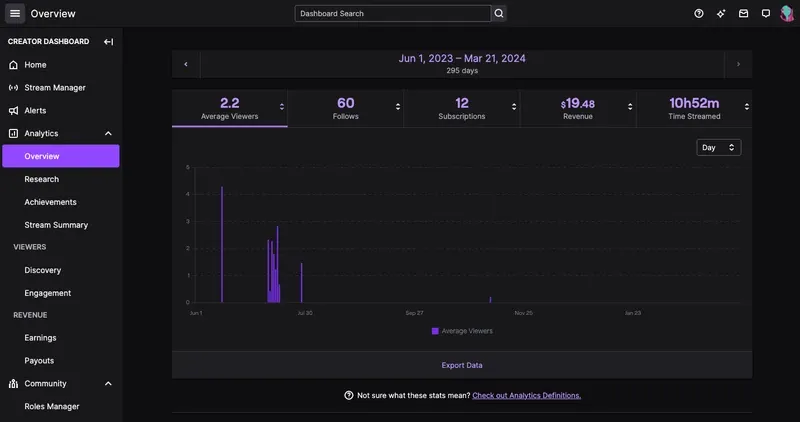
At the time of writing, Twitch organizes creator analytics into several areas, including:
- Overview
- Research
- Stream Summary
- Achievements
- Discovery
- Engagement
- Earnings
The Stream Summary is especially useful when you’re reviewing one particular broadcast, while Discovery helps you understand where viewers came from and Engagement gives you more information about how your audience behaves across Twitch. Monetized creators can also use Earnings analytics to break down revenue sources.
Twitch changes the dashboard from time to time, so the exact layout may move around. The important bit is what you’re looking for once you get there.
1. Average Viewers
If you only tracked one viewership number, we’d start here.
Average viewers measures your average concurrent viewership during a stream or selected period. Twitch officially defines Average Viewers as your average concurrent viewership.
That makes it much more useful than bragging about the biggest number you saw flash on screen for three minutes.
Imagine these two streams:
Stream A
- Peak viewers: 45
- Average viewers: 9
Stream B
- Peak viewers: 22
- Average viewers: 17
Stream A had the sexier screenshot.
Stream B probably had the healthier sustained audience.
Average viewership can help you compare:
- Games
- Categories
- Stream times
- Stream lengths
- Recurring formats
- Special events
Instead of asking whether 12 average viewers is “good,” compare it to your own baseline.
If you’ve averaged eight viewers for a month and a new format consistently averages 14, that’s useful information.
If you want to improve this number, our guide on getting more Twitch viewers goes deeper into the growth side.
2. Peak Viewers
Peak viewers is the highest concurrent audience you reached during a stream or selected period.
It’s useful, but dangerous when your ego gets hold of it.
Let’s say you normally average 15 viewers and peak around 25.
Then somebody raids you with 150 people.
Suddenly your dashboard shows an enormous peak.
Fun? Absolutely.
Evidence that your regular audience suddenly increased tenfold?
Not quite.
Instead, use peak viewership to identify moments worth investigating.
Did the spike happen after:
- A raid?
- A particularly funny moment?
- Switching games?
- Starting a giveaway?
- Playing with another creator?
- Posting on social media?
- A big in-game event?
Then ask the more important question:
How many of those people stuck around?
Peak viewers tells you where attention appeared.
Average viewers and watch time help tell you whether you kept it.
3. Unique Viewers
Unique viewers helps answer a different question:
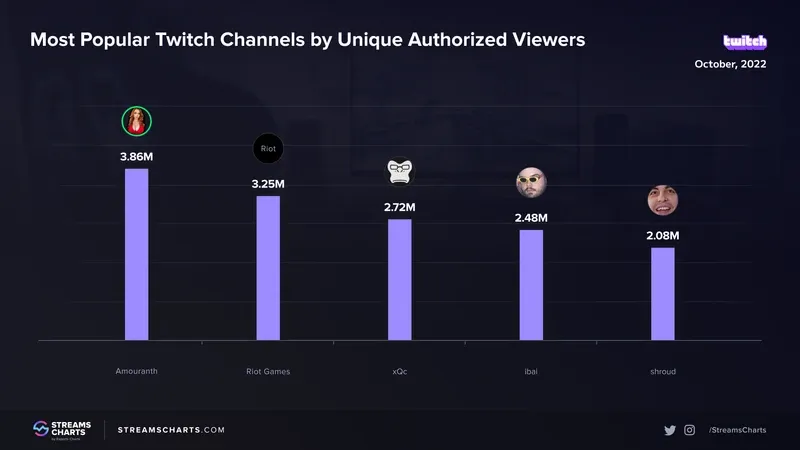
How many different people actually reached my stream?
Twitch defines Unique Viewers as the number of unique people who viewed your live streams across the selected date range. If the same viewer watches multiple streams during that period, Twitch counts them once for this metric.
This gets really useful when you compare it with average viewership.
High Unique Viewers + Low Average Viewers
People are finding you.
They’re just not staying.
That could mean investigating things like:
- A weak opening
- Long stretches of dead air
- Poor audio
- An overly long Starting Soon screen
- A misleading title
- The wrong game/category fit
- Weak pacing
- Content that isn’t matching what people expected when they clicked
In other words:
Discovery may not be your problem. Retention might be.
Low Unique Viewers + Strong Average Viewers
Now flip it around.
Maybe your regulars consistently stay for hours, but hardly anybody new reaches the stream.
That’s a completely different problem.
Your content may be doing its job once somebody arrives, while discoverability is holding the channel back.
That’s exactly why looking at one number alone can send you chasing the wrong fix.
4. Live Views
Here’s a common trap:
“My Twitch Analytics says I got 300 views. Why didn’t I have 300 viewers?”
Because those aren’t the same metric.
Twitch defines Live Views as the total number of unique views from live content, while Average Viewers measures concurrent viewership.
Those numbers answer different questions.
Someone can enter your stream, watch for a while, and leave. Another person can arrive later.
Both contribute to your overall reach without ever being present simultaneously.
So saying:
“My stream got 300 live views”
does not mean:
“300 people were watching me at once.”
If you want to know how large your sustained live audience was, average viewers is much more informative.
Treat live views as a reach metric, not a concurrent-audience metric.
5. Watch Time
Reach tells you whether people arrived.
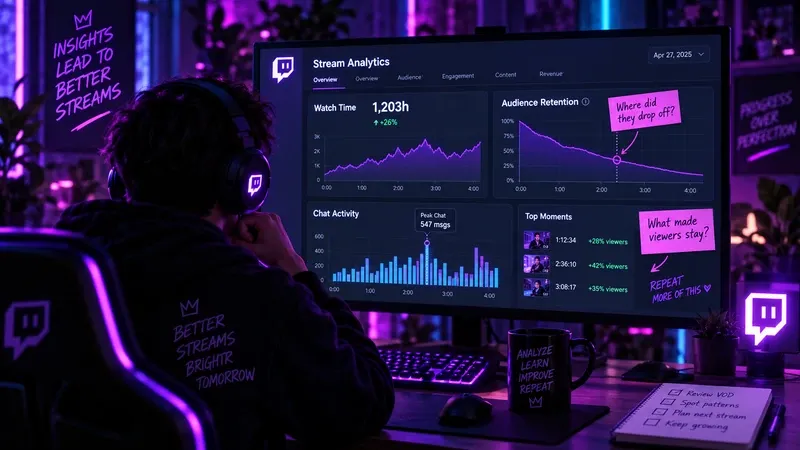
Watch time starts telling you whether they cared enough to stick around.
Twitch’s analytics includes total time watched across viewers.
Imagine two streams each reach 100 unique viewers.
On one stream, people arrive and leave almost immediately.
On the other, many of them stick around for half an hour, an hour, or longer.
Those streams didn’t perform equally just because both reached 100 people.
Watch time can help you evaluate:
- Stream pacing
- Game choice
- Break frequency
- Content segments
- Your opening 15–30 minutes
- Longer versus shorter streams
- Whether viewers disappear during certain portions
If your unique viewer count is healthy but watch time is consistently poor, that’s a signal to stop worrying exclusively about getting more clicks and start studying what happens after the click.
The objective isn’t merely getting someone through the door.
It’s giving them a reason not to walk straight back out.
6. Unique Chatters and Chat Activity
Twitch defines Unique Chatters as the number of unique viewers who chatted during the selected date range. It also separately tracks total chat messages.
That’s useful because viewer activity and chat activity aren’t the same thing.
Some viewers will happily watch you for three hours without typing a single message.
They’re lurkers. They count too.
Likewise, the list of people connected to Twitch chat shouldn’t be treated as a live viewer counter. We’ve covered that distinction in our guide to why Twitch can say you have one viewer when more people appear to be in your channel.
Instead, use chat analytics to ask:
- Which streams get people talking?
- Which segments wake chat up?
- Are your questions actually generating responses?
- Is interaction improving over time?
- Are lots of people watching but very few participating?
A healthy stream doesn’t need every viewer firing messages into chat like it’s the final minute of a Champions League match.
But visible interaction can make a stream feel considerably more alive.
That’s also where a Twitch Chat Bot can fit into a broader channel-growth strategy when you’re working on visible chat activity alongside your actual content and community.
7. New Followers
Your lifetime follower count is nice.
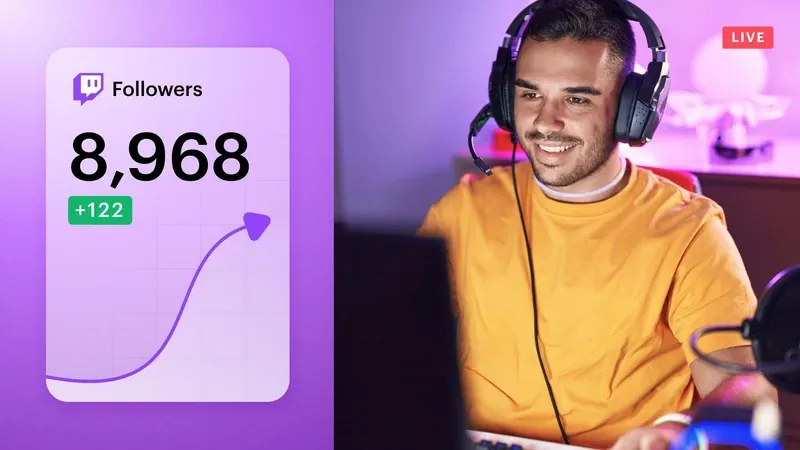
Followers gained per stream is more useful.
Twitch tracks New Followers as the total number of new followers added during the selected period.
Now start comparing streams.
Maybe your Monday streams average:
- 20 viewers
- 120 unique viewers
- 3 new followers
Your Friday format averages:
- 17 viewers
- 90 unique viewers
- 9 new followers
The Friday stream reaches fewer people but converts substantially more of them into potential returning viewers.
That’s worth investigating.
Look for patterns around:
- Category
- Format
- Stream topic
- Collaborations
- Calls to action
- Events
- Stream length
- Time slot
More traffic with almost no follower growth can mean you’re attracting people who aren’t finding enough reason to come back.
The goal isn’t to collect profile follows like Pokémon cards.
It’s to build an audience that returns when you go live again.
8. Discovery and Traffic Sources
Here’s one of the most underused parts of Twitch Analytics:
Where did your viewers actually come from?
Twitch’s Discovery analytics is specifically designed to help creators understand where viewers originate and how they find a channel. Its analytics documentation also describes a Views Breakdown covering sources such as:
- Your followers
- Twitch directories
- Twitch recommendations
- Other Twitch channels
- External traffic
This matters because growth looks very different depending on the source.
External traffic is increasing
Your TikTok, YouTube, Discord, X, website, or other promotion may be working.
Category or directory traffic is increasing
Your game or category selection may be exposing you to more browsers.
Traffic from other Twitch channels is increasing
Raids, collaborations, networking, or shared communities might be paying off.
Twitch recommendation traffic is increasing
Something may be helping more viewers encounter your stream through Twitch’s own discovery surfaces.
Don’t jump from that to pretending we know Twitch’s secret algorithm formula.
We don’t.
Use source data for what it’s good at: identifying where the audience came from, then running more tests around the channels already showing promise.
9. Follower Conversion Rate
This one isn’t a magic official Twitch score.
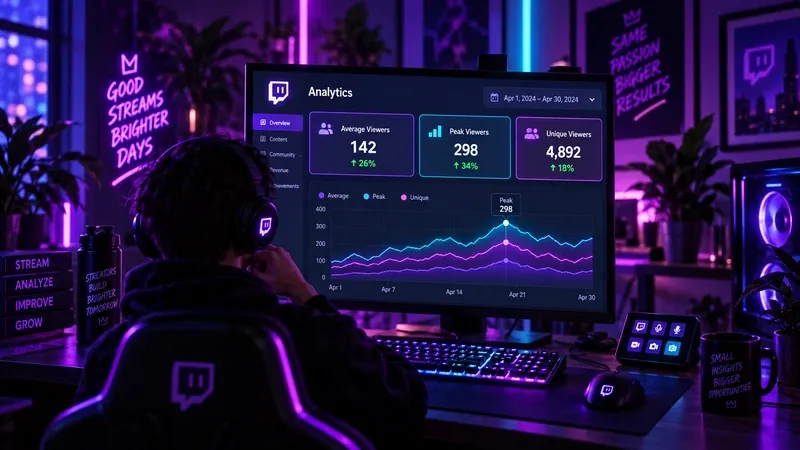
It’s a simple ratio we recommend calculating yourself:
New followers ÷ unique viewers × 100
Suppose two streams perform like this:
Stream A
500 unique viewers 10 followers
Follower conversion: 2%
Stream B
200 unique viewers 12 followers
Follower conversion: 6%
Stream A reached far more people.
Stream B persuaded a much larger share of its audience to follow.
That makes Stream B interesting.
Ask:
- Was the content more focused?
- Did you play a different category?
- Was there more interaction?
- Did you actually ask people to follow?
- Was the stream more memorable?
- Did you explain what you normally stream and when you’d be back?
Don’t obsess over finding one universal “good Twitch follower conversion rate.”
Your own baseline is more useful.
Track it across similar streams, change something intentionally, and see whether the number improves.
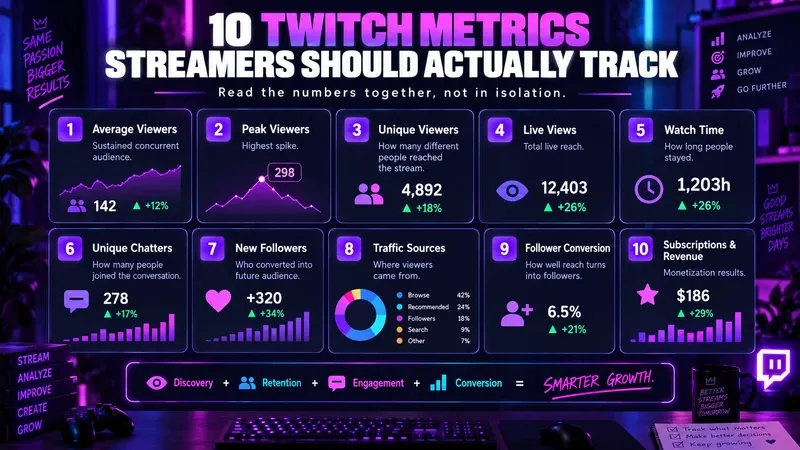
10. Subscriptions and Revenue
Once your channel is monetized, Twitch Analytics can also help answer the question everybody eventually asks:
Is the audience actually turning into revenue?
Twitch’s Earnings analytics can show revenue from sources including subscriptions, ads and Cheering, with more detailed revenue and subscription breakdowns available to eligible creators.
Useful numbers to compare include:
- Paid subscriptions
- Gifted subscriptions
- Prime subscriptions
- Bits
- Ad revenue
- Overall revenue
But don’t make the mistake of optimizing every stream purely around whichever one made the most money last Tuesday.
Revenue is one signal.
You should still care about:
- Viewership growth
- Retention
- Community engagement
- Returning viewers
- Whether you actually enjoy making the content
- Whether the format is sustainable
If monetization is becoming a priority, you can also use our Twitch tools to estimate Twitch ad revenue and subscription earnings.
3 Twitch Analytics Ratios Worth Calculating Yourself
Raw metrics get much more interesting when you start combining them.
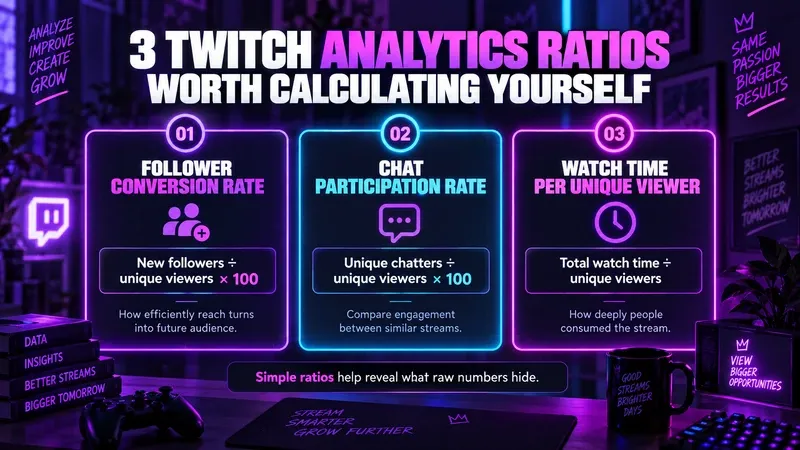
Here are three simple ratios we like.
1. Follower Conversion Rate
New followers ÷ unique viewers × 100
This gives you a rough indication of how efficiently reach turns into future audience.
2. Chat Participation Rate
Unique chatters ÷ unique viewers × 100
This won’t tell you whether a stream is “good” or “bad.” Plenty of great viewers lurk.
It does give you another way to compare engagement between similar broadcasts.
3. Watch Time per Unique Viewer
Total watch time ÷ unique viewers
Again, this isn’t an official Twitch KPI we’re pretending Twitch invented.
It’s simply a useful way to compare how deeply people consumed one stream versus another.
Maybe one category attracts twice as many people but keeps them for a fraction of the time.
That’s exactly the kind of trade-off raw traffic numbers can hide.
How to Read Twitch Metrics Together
This is where Twitch Analytics becomes genuinely useful.
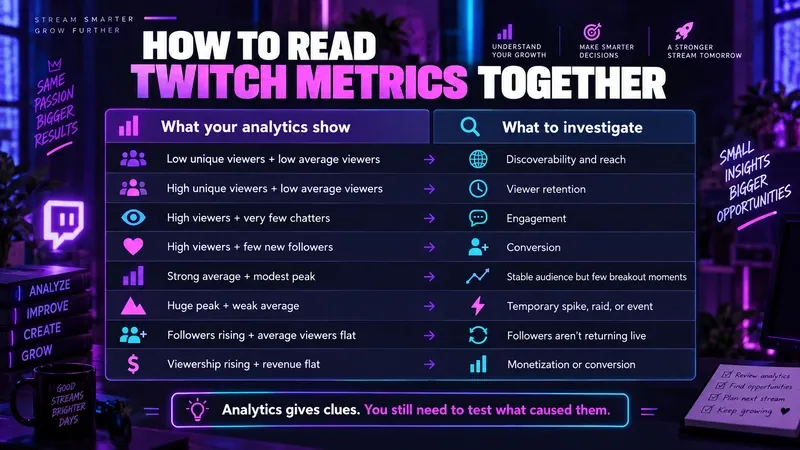
Instead of staring at one metric, look for combinations.
| What your analytics show | What to investigate |
|---|---|
| Low unique viewers + low average viewers | Discoverability and reach |
| High unique viewers + low average viewers | Viewer retention |
| High viewers + very few chatters | Engagement |
| High viewers + few new followers | Conversion |
| Strong average + modest peak | Stable audience but few breakout moments |
| Huge peak + weak average | Temporary spike, raid, or event |
| Followers rising + average viewers flat | Followers aren’t returning live |
| Viewership rising + revenue flat | Monetization or conversion |
Notice the wording there:
Investigate.
Not:
We have scientifically diagnosed your Twitch channel from six numbers.
Analytics gives you clues.
You still need to figure out what caused them.
Don’t Judge Your Twitch Channel From One Stream
Streamer brain is ruthless.
Monday goes well:
We’re so back.
Tuesday performs terribly:
Career over. Delete Twitch. Become a goat farmer.
Neither reaction is particularly useful.
Individual streams are noisy.
A raid can distort your peak. A major game release can temporarily change category traffic. A holiday can destroy your normal schedule. One stream might simply be weird.
Instead, compare:
- Week versus week
- Month versus month
- Similar categories
- Similar stream lengths
- The same days and time slots
- Repeated formats
Twitch built Analytics specifically to let creators compare performance over time and make decisions based on what is actually working.
One terrible Tuesday is a terrible Tuesday.
Five terrible Tuesdays might be a pattern.
A Simple Twitch Analytics Routine After Every Stream
You don’t need a NASA control room.
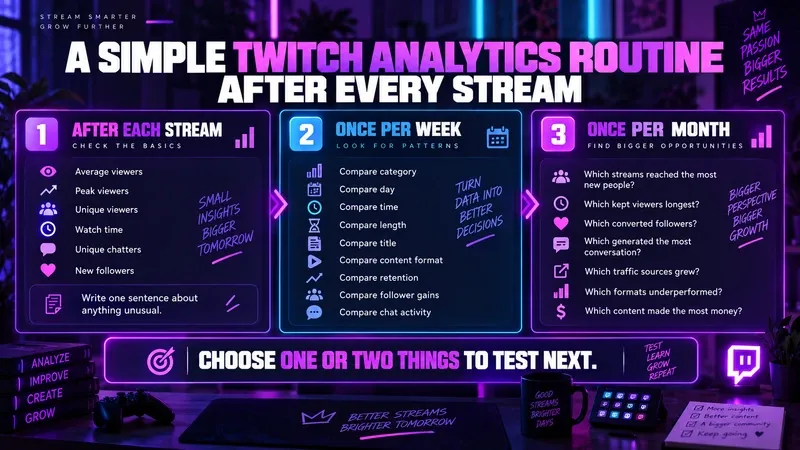
Use a simple process.
After Each Stream
Record:
- Average viewers
- Peak viewers
- Unique viewers
- Watch time
- Unique chatters
- New followers
Then write one sentence about anything unusual.
Maybe:
Big peak came from a raid.
Or:
Viewership dropped hard after switching games.
That context becomes useful later.
Once Per Week
Compare your streams by:
- Category
- Day
- Time
- Length
- Title
- Content format
- Viewer retention
- Follower gains
- Chat activity
Look for repeat patterns rather than one-offs.
Once Per Month
Ask:
- Which streams reached the most new people?
- Which kept viewers longest?
- Which converted the most followers?
- Which generated the most conversation?
- Which traffic sources grew?
- Which formats underperformed repeatedly?
- Which content made the most money?
Then choose one or two things to test next.
Don’t change your schedule, game, title style, microphone, overlays, stream length, personality, haircut, and entire reason for existence at the same time.
If everything changes, you won’t know what actually worked.
Twitch Analytics Mistakes to Avoid
Before you disappear into your Creator Dashboard for three hours, here are a few traps worth avoiding.
Obsessing Over Peak Viewers
A massive spike looks cool.
Sustained audience matters more.
Always compare peak viewership with average viewers and what happened after the spike.
Treating Live Views Like Concurrent Viewers
They’re different metrics.
Don’t tell everybody 500 people watched you simultaneously because your analytics shows 500 live views.
Your friends will eventually notice.
Tracking Followers Without Conversion
A growing follower total is good.
Knowing which streams actually generated those followers is better.
Ignoring Traffic Sources
If one external platform is suddenly bringing in viewers, that’s something you should know.
Do more of what is already working.
Ignoring Retention
Reaching more people doesn’t help much if everyone leaves.
Unique viewers and watch time should be read together.
Changing Everything at Once
Analytics is most useful when you’re actually testing something.
Change one meaningful variable, gather enough data, compare the result, then make the next decision.
Otherwise you’re basically shaking the machine and hoping better numbers fall out.
Where ViewBotter Fits Into Twitch Analytics
Once you start reading your Twitch analytics properly, most growth problems become easier to separate into two big questions:
Are enough people reaching the stream?
And:
What happens once they’re there?
Retention, content quality, consistency, pacing and community are things you still have to build.
But if your analytics repeatedly suggest that the bigger problem is getting initial visibility and activity around the stream, that’s where ViewBotter fits.
Our Twitch Viewer Bot is built around live viewer activity, while our Twitch Chat Bot focuses on visible chat activity.
If you’d rather see how it works before paying for anything, start with the free Twitch viewer bot trial or compare the available options on our pricing page.
Use those tools as one part of a broader growth strategy — not as a replacement for making streams people actually want to watch.
Because eventually the analytics will tell you that story too.
FAQs
What Is the Most Important Twitch Analytics Metric?
For most growing streamers, average viewers is one of the most useful overall metrics because it measures sustained concurrent viewership rather than a temporary spike. That said, it should still be compared with reach, watch time, follower growth and engagement.
What Is the Difference Between Average Viewers and Unique Viewers on Twitch?
Average viewers measures your average concurrent audience. Unique viewers measures the number of distinct people who watched your streams across the selected date range. You can therefore have many unique viewers while maintaining a relatively small concurrent average.
Are Peak Viewers Important on Twitch?
Yes. Peak viewers can help identify moments when a stream attracted unusual attention. However, a raid or temporary event can create a high peak without meaning your sustained audience increased. Compare peak viewers with your average viewership and retention metrics.
Why Do I Have More Twitch Views Than Average Viewers?
Because they measure different things. Views accumulate as people access your live content, while average viewers measures the number of concurrent viewers you maintained on average.
Why Do I Have Viewers but No Chatters?
Not everybody watching Twitch chats. Many viewers lurk. Twitch also treats viewership and chat participation as separate metrics, which is why your viewer count and chat-user activity should not be expected to match exactly.
How Often Should I Check Twitch Analytics?
Looking at your Stream Summary after each stream can help you spot notable events, but make bigger strategic decisions using several streams or longer weekly and monthly trends. Twitch’s analytics tools are designed to let creators compare performance over time.
Can Twitch Analytics Help You Grow?
Yes, if you use the numbers to make decisions. Twitch Analytics can help you identify stronger categories, traffic sources, formats, audience behavior and revenue trends. The data won’t tell you exactly what to do, but it can show you where to investigate and what to test next.